TS 10th Class Social Important Questions 6th Lesson The Population
1 Mark Questions
Question 1.
Give the main reason for decreasing death rate during the last decade in India?
Answer:
- Decline in the death rate is due to effective control of dreadful epidemic diseases through the advancement of medical technology and healthcare delivery system
- Spread of education, development of science and technology and effective use of the
resources have given greater scope and prospects for sustainability
Question 2.
Observe the following table and answer the questions?
Male Female literacy rate In India?
| Year |
Female literacy |
Male literacy |
Literacy rate |
| 1961 |
15.35% |
40.45% |
28.30% |
| 1971 |
21.97% |
45.96% |
34.45% |
| 1981 |
29.76% |
56.38% |
43.57% |
| 1991 |
39.29% |
63.13% |
52.21% |
| 2001 |
54.67% |
75.26% |
64.84% |
| 2011 |
65. 46% |
82.14% |
74.04% |
Question (a) By what percentage is male literacy more than that of female In 2011?
Answer:
Male literacy s more Than that of female in 2011 is 16.68%
Question (b) What Information does the above table give us?
Answer:
The above table gives us the information about male and female literacy rate in India during 1961 -2011
Question (c) In which period is the literacy rate increased more?
Answer:
The literacy rate increased more during the period 1991 - 2001
Question (d) How do you understand the female literacy?
Answer:
- When compared with male literacy, female literacy rate is low
- In 1961 female literacy is very low. But it is in increasing level. During 1991- 2001 female literacy is highly increased
Question 3.
Observe the given bar graph and answer the questions?
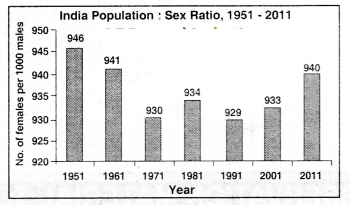
Question (a) What does the above graph tell about?
Answer:
The above graph tells about India PopulatIon - Sex Ratio (1951 .2011)
Question (b) What does the change in sex ratio show when compared with 1991 year to that of 2011 year?
Answer:
The sex ratio Is increased (929 to 940)
Question (c) What do you mean by sex ratio?
Answer:
Sex ratio is the number of females per 1000 males in the population
Question (d) Mention the reason behind the low female population In India?
Answer:
- Gender discrimination
- Illiteracy
- Lack of Medical Facilities
- Not providing nutritious food
- Parental attitude
Question 4.
Observe the following table and answer the questions.
Census 2011 - Data related to literacy rate in Kerala and Bihar?
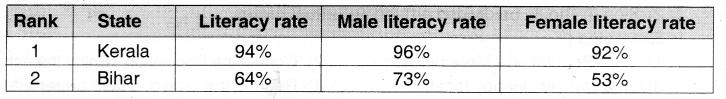
Question (a) What is table about?
Answer:
The table is about literary rate in Kerala and Bihar considering Census 2011
Question (b) Mention one reason for low literacy rate among the women?
Answer:
Reasons for low literacy rate among the women:
Following traditions and conventions Less priority to girl education
Question 5.
What processes influence the change in population size?
Answer:
The processes that influence the change In population size are
- births
- deaths
- Migrations
Question 6.
Observe the given graph and answer the Questions?
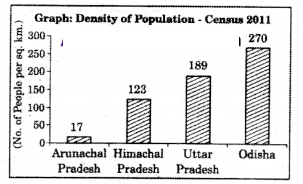
Question (a) Which state has the highest density of population?
Answer:
The state that has the highest density of population is Odisha
Question (b) Why does Arunachal Pradesh have the least density of population?
Answer:
Arunachal Pradesh has the least density of population due to hilly and rocky nature of the terrain
Question 7.
How much percent of the working people In India are In the unorganised sector?
Answer:
Ninety-two percent of the working people jn India are in the unorganised sector
Question 8.
What is Important regarding population study?
Answer:
It is important to understand population numbers, its distribution and characteristics that provide the basic background for understanding and appreciating the other aspects
Question 9.
What does the census of India provide?
Answer:
The census of India provides us with Information regarding the population of our country
Question 10.
What is a census?
Answer:
A censuss the procedure of systematically acquiring and recording Information about the members of a given population
Question 11.
Who collects the census?
Answer:
The central government institution. Census of India. organizes the collection and recording of this information
Question 12.
What does the age structure of a population refer to?
Answer:
The age structure of a population refers lo the number of males and females in different age groups in a country
Question 13.
How can we group the population of a nation?
Answer:
The population of a nation is generally grouped into three broad categories
- Children (Below 15 years)
- Working Age (15.59 years)
- Aged (Above 59 years)
Question 14.
Why are some children forced to work?
Answer:
Some children are forced to work because of economic conditions
Question 15.
Who gets retirement pension?
Answer:
Those who work and retire In organised sector may get retirement pension
Question 16.
What is sex ratio?
Answer:
Sex ratio is the number of females per 1000 males in the population
Question 17.
What does the sex ratio Indicate?
Answer:
The sex ratio indicates a hidden form of discrimination
Question 18.
What does medical research show?
Answer:
Medical research shows that given similar circumstances girl children survive much
better than boys
Question 19.
Which tends towards unequal sex ratios? Give reason for that?
Answer:Regions that have unequal gender relations that favour the males and discriminate against the females tend towards unequal sex ratios. This can happen even though they have high incomes
Question 20.
Give an example of the state which has positive sex ratio?
Answer:
Kerala
Question 21.
What are the reasons for female foetus Infanticide?
Answer:
Due to the preference for male children parents may decide to abort female child before birth Many adults consider female children as a burden
Question 22.
Who is treated as literate?
Answer:
According to the Census of 2011. a person aged 7 years and above who can read and write with understanding in any language is treated as literate
Question 23.
What is literacy?
Answer:
Literacy is a key for socioeconomic progress
Question 24.
Write the equation of population change?
Answer:
Population change (absolute numbers) = (Population at later date) - (Population at earlier date)
Question 25.
What Is birth rate?
Answer:
Birth rate is the number of live births per thousand persons in a year
Question 26.
What is death rate?
Answer:
Death rate is the number of deaths per thousand persons in a year
Question 27.
What is the change in birth rate and death rate at present?
Answer:
There has been the rapid decline in death rates but till recent times, birth rates were not decreasing substantially
Question 28.
Why did the famines decline after 1900?
Answer:
After 1900 terms declined because of famine relief, movement of grain, ration shops and an active public voice in a democracy
Question 29.
Which epidemics were controlled?
Answer:
Cholera, plague and to some extent malaria were controlled
Question 30.
What is total fertility rate?
Answer:
The total fertility rate is the number of children that is likely to be born to a woman if she were to live to the end of her childbearing years and bear children in accordance with current pattern
Question 31.
What is the present fertility rate in India?
Answer:
Present fertility rate in India is 22
Question 32.
What is the fertility rate In Telangana?
Answer:
it is 1.8
Question 33.
What is the third component of population change?
Answer:
The third component of population change is migration
Question 34.
What is migration?
Answer:
Migration is the movement of people across regions and territories
Question 35.
How many kinds of migrations are there?
Answer:
There are two kinds of migration
- internal migration
- international migration
Question 36.
How is population density calculated?
Answer:
Population density is calculated as the number of persons per unit area
Question 37.
Why do the plains have very high density of population?
Answer:
The northern plains and the plain in the south have, high to very high populations, densities, because of the flat plains with fertile soils and abundant rainfall
2 Marks Questions
Question 1.
Observe the following graph and write a paragraph analyzing it?
 Answer:
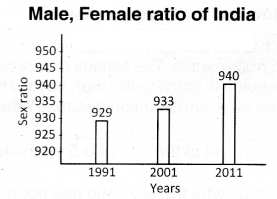
- The bar graph is about male, female sex ratio of India
- It gives the sex ratio in 1991, 2001 and 2011
- Sex ratio is increasing from 1991 to 2011
- The sex ratio in India is a cause of concern. Ever since independence, it has been constantly decreasing and with 940 in 2011 it is also alarming
Question 2.
Prepare two slogans on Control of population growth?
Answer:
- Slogan should reflect the theme of controlling population growth
- Slogan should be divided around two equal halves
Examples:
- More Population - More problems
- Control the Population - Enjoy the nature
- Small family - Happy family
- Reduce the crowd - Have better future
Question 3.
What are the reasons for the decline in the death rate after 1900?
Answer:
From 1900 onwards and especially post-independence,impact of famines declined because of famine relief, movement of grails, ration shops. and an active public voice in a democracy. Epidemics such as cholera, plague and to some extent malaria have also been controlled. Sanitation facilities are involved. Clean water and nutrition provision is initiated, Antibiotics and vaccines also contributed better health
Question 4.
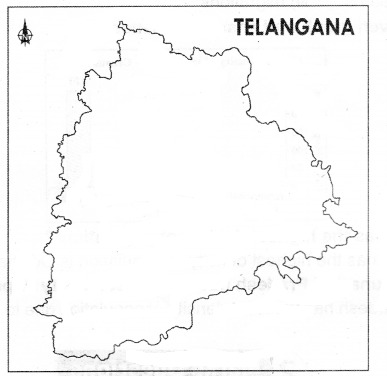
Draw the outline map of Telangana.?
Answer:
Question 5.
Write some reasons for population growth in India?
Answer:
- High birth rate
- Low death rate
- Improvement in medical facilities
- high fertility rate in young couples
- A decline in fancies
- Illiteracy
Question 6.
Give some examples of this discrimination?
Answer:
Women and girls in particular face unequal opportunities for education and development In the most basic needs of nutrition, child care and health also they are discriminated against - they get less of these things than males. This can happen even within the same family. This discrimination is not always obvious. Nor is it accepted
Question 7.
What does the census show regarding to child births? Give reasons for that?
Answer:
The census shows that in the age group 0-5, the number of girls who survive is much lower than boys. This can only happen if there is some discrimination in their care and nutrition otherwise the physical chance of survival Is better for girls
Question 8.
Write about womens education?
Answer:
Womens education has been a powerful force in reducing discrimination against women. There is definitive evidence that womens literacy and schooling reduce child mortality and work against the selective neglect of the health of girls
Question 9.
Write an account of literacy rate?
Answer:
At independence in 1947. 12% of the population was literate. In 2001, It was 65%.lt grew to 74% by 2011. However, the 2011 Census shows that there is a wide disparity in literacy rates for men (82%) and women (65%).
Question 10.
Why does the population size change?
Answer:
Population is dynamic. The nurturers, distribution and composition of the population are always changing. This is because of the interaction the three processes:
- births
- deaths and
- migrations
Question 11.
What is the change in population size? How can it be expressed?
Answer:
The change in the of population is the difference in the number of inhabitants of a country territory during a specific period, say during the last ten years. Such a change can be expressed in two ways
- as absolute numbers
- as percentage change
Question 12.
Write the equation of population change In a place?
Answer:
Population change in a place = (number of births + number of in-migrants) -(number of deaths + number of out-migrants). A positive number means the population has increased by that number. A negative mixers shows that it has decreased by that number
Question 13.
What is rate or pace of population increase?
Answer:
The rate or the pace of population increase is important. It is studied in percent per annum, e.g. a rate of increase of 2 per cent per annum means that in a given year, there was an increase of two persons for every loo persons in the base year. This works like compound interest. This is referred to as the annual growth rate. Indias population has been steadily increasing
Question 14.
What are the factors that influence population densities in states like Assam?
Answer:
Assom and most of the peninsular states have moderate population densities. Hilly, dissected and rocky nature of the terrain, moderate to low rainfall, shallow and less fertile soils have influenced population densities in these areas
4 Marks Questions
Question 1.
Read the text given below and write your opinion.
In India, 103 female babies are born as against loo male babies. However more female babies die than the male babies. The census shows that in the age group 0-5 years, the number of girls who survive is much lower than boys. This can only happen if there is some discrimination in their care and nutrition because otherwise the physical chance of survival is better for girls?
Answer:
More female babies are born yet at the age of 0-5 years the number of girls who survive is much lower than boys.
The following reasons give us why the sex ratio has been declining
- Most of the women are illiterate, so they are unable to realise the importance of a girl child
- Most of the families in India are patriarchal, so men dominate the women and force them to abort against for a girl child
- Most of the families give importance for a boy child to increase their clan
- Even though they have high income, parents give less importance for girl child in all spheres
Question 2.
Observe the Bar graph and answer the questions given below?
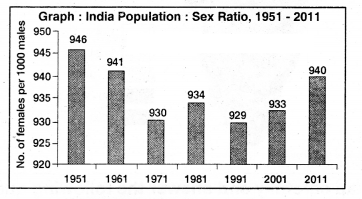
Question (a) Which year has the least number of females?
Answer:
In the year 1991, the number of females es least
Question (b) What do you mean by Sex ratio?
Answer:
The number of females per 1000 males is called sex ratio
Question (c) Since 1951, what changes do you observe In Sex ratio?
Answer:
During 1951-1971 the sex ratio ¡s decreasing whereas 1991 onwards it has been increasing gradually though the literacy rate in 1951 is low, the sex ratio is high
Question (d) What Is to be done to prevent the decrease In female number?
Answer:
The concept of equality between male and female is to be developed by organizing campaigns. The laws related to pre-natal diagnostic tests should be brought out, They should be implemented in true spirit
Question 3.
What is the influence on society when female percentage decreases In sex ratio?
Answer:
Influence on society when female percentage decreases In sex ratio
- Marriage-related problems
- Crimes related to sexual assault increase
- Kanyashualkam may revive
- Gender discrimination reduces
- Mankind struggles to service
- Population decreases
- Family relations may be affected
- Human relations get disturbed
- Importance to women - increased
Question 4.
Read the given paragraph and comment
We often hear people talk of population growth in alarmed tones. These people are often literate arid talk about others not benefitting because there are too many people who have to share very few resources?
Answer:
According to the given paragraph the population growth affects many ways people should aware of this and the literate people talk about the benefits share of resources is not balancing. Very few people are using more resources whereas many people are using very less resources
Countries like USA are using more natural resources though its population is less than 5% of the world population. In India, it is less than 16% of population of the world is using less natural resources. In India population is steadily Increasing. If population increases in this way, one day India would be the first ¡n world population. Population is not a curse to the countrys development, It is a boon for the development of the country. People in any country can be divided into three categories
They are skilled, semi-skilled and unskilled. The Government has to utilise the services of the skilled for the nations development. The semi skilled should be made skilled. The unskilled should be provided with some training and so they would be doing some sort of productive work which would be strengthening Gross Domestic Product. Equal distribution of resources should be the target of the Government. The underdeveloped countries should focus on improving qualities of workforce. So population is not a problem. Its a boon
Question 5.
Describe the categories of working population?
Answer:
The Census of lna groups the working population into four categories. Cultivators are farmers,who farm or supervise the land that they own or take on rent. Agricultural labourers are those who work on anothers farm for wages in cash or kind. Workers in household industries would be those who are manufacturing or repairing some product at home such as dehusking of paddy, bidi workers. potters, weavers, repair of footwear. manufacture of toys, matches. etc. Other workers would be those who are employed in
factories, trading, casual labour and all other occupations
Question 6.
Why did birth rates remain high for such a long period?
Answer:
One set of reasons has to do with what has happened in the past. If in the overall population, the percentage of young people Is high, then in the coming years they would grow up. get married and have children. The total number of such children added would be high because we began with a population with a large number of young people
The other reason is the number of children that couples wish to have. This In turn Is related to how many children survive, what social security people have and the preference of male child in society
Question 7.
Read the following paragraph and interpret.
Think of the various ways In which government should have special schemes for different age groups. Examples could be midday meal schemes; anganwadi programmes, etc. Why are they necessary?
Answer:
The given paragraph focuses on special schemes suggestive for the sake of the poor and the needy people. Already midday meal scheme and Anganwadi programmes are there. According to my opinion the midday meal scheme came out with the initiation of the Supreme Court of India. Many of the poor students are not attending schools In the afternoon. Their parents may go to fields for work. As the doors of these families locked and not food is available they became dropouts. To avoid this, midday meal scheme came out
Now the dropout rate is decreased. As the people are poor many programmes are to be taken up. In many of the schools, it is not functioning well. Schemes for pregnant women, sick people, physically challenged, destitute, mentally retarded and street children are also necessary, They should be provided with a sufficient mechanism so as to make them lead their lives with satisfaction
Whatever the programme or scheme taken up. it should be worked out in a right way with the true spirit. The objective Is not fulfilled in many of the schemes. Proper vigilance and punishment to the culprits leed to successful implementation. How many schemes are running is different from how they are running. So implementation is important
Question 8.
Read the following paragraph and write your comments.
Womens education has been a powerful force In reducing discrimination against women. There is definitive evidence that womens literacy and schooling reduce child mortality and work against the selective neglect of the health of girls?
Answer:
According to the paragraph given education of the women will solve the problem of discrimination, It s very important to educate the girls. Their literacy and schooling should be increased so as to bring social change with regard to discrimination against women
My comments on this paragraph are that the village people are mostly illiterates and they dont want to send their daughters to schools and colleges for education, In this decade, we observe that many of the parents in villages changed their notions and started sending them even to cities and towns and encouraging in getting higher education. They are getting good jobs and discharging their duties well, If a mother is educated, she may not neglect her female baby.
An educated mother can take care of both male and female child in a better way. If everyone understands this spirit in a right way it will be helpful to the society
Question 9.
Read the following paragraph and Interpret.
Why did birth rate rename high for such a long period? One set of reasons has to do with what has happened in the past. If in the overall population, the percentage of young people is high, then in the coming years they would grow up, get married and have children. The total number of such children added each year would be high because we began with a population with a large number of young people?
Answer:
The given paragraph says that the young people are more in number and in due course of time, they get married and have children. This leads to population increase, This adding of population is going on over the period
There are so many reasons for high birth rate in our country. Illiteracy of rural people, religious attitudes and waiting for male child are some of the reasons. Early marriages also cause for population growth. The family planning programmes are not successfully implemented. Recently the trend is changing
Newly married couple plan to have one or none baby. They feel that many children will be the burden for the family. They understand that they may not provide sufficient food, clothes, education and health facilities to their chlidren They dont provide adequate jobs to their children
Awareness programmes should be initiated among the people. Strict implementation of family planning is necessary. People also should participate in the campaign. Everyone should take responsibility. Increase in population is not the problem of the nation but It affects the lives of the people
Question 10.
 If we were to show the area of countries on the basis of population, it would look
like this. How Is It different from other world maps? Discuss?
If we were to show the area of countries on the basis of population, it would look
like this. How Is It different from other world maps? Discuss?
Answer:
- If we were to show the area of countries on the basis of population, it definitely would look different from ordinary world map
- The most populous countries are shown in larger area and countries with less population are shown as smaller in area
Question 11.
Observe the following graph
 Now answer the following questions?
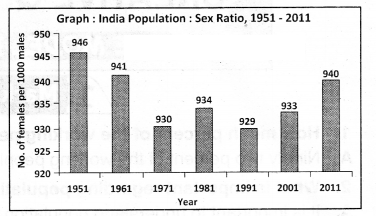
Question (a) What was the number of females per 1000 males in 1951?
Answer:
It was 946
Question (b) When was the sex ratio low?
Answer:
In 1991
Question (c) When was the sex ratio high?
Answer:
In 1951
Question (d) How was the sex ratio from 1951-2011?
Answer:
It was irregular
Question (e) What was the sex ratio in 2011?
Answer:
It was 940/1 000
Question (f) What is the graph about?
Answer:
This graph Is about sex ratio of Indian Population during 1951-2011
Question (g) How often does the census take place?
Answer:
Once in ten years
Question (h) How many times it is recorded less than 940?
Answer:
It is recorded our times (1971.1981.1991,2001)
Question (i) What do you mean by sex ratio?
Answer:
Sex ratio is the number of females per one thousand males in the total population
Question (j) From which year onwards is sex ratio constantly Increasing?
Answer:
It is increasing constantly from 1991
Question (k) The sex ratio is a cause of concern In India. Give reasons?
Answer:
The sex ratio in India is a cause of concern. Ever since independence, it has been constantly decreasing and with 940 in 2011 it is also alarming
Question 12.
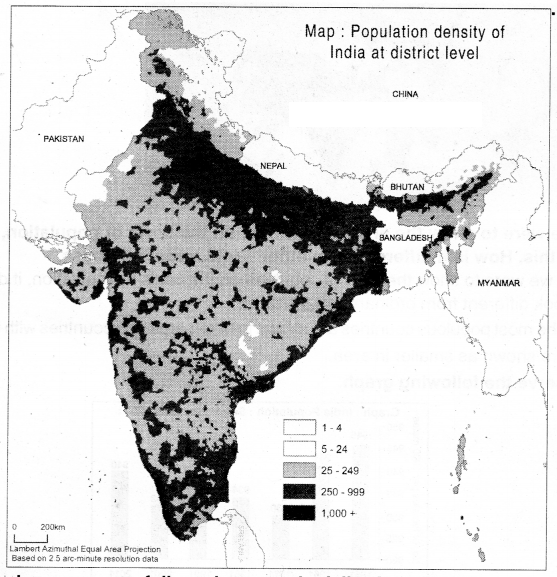 Read the above map carefully and answer the following questions?
Question 1. What are the areas of extremely low-density of population. Write reasons?
Answer:
Areas with extremely low population density are Jamu and Kashmir and Arunachal Pradesh. These areas are either mountainous, hilly areas or forests
Question 2. What are the areas of very high population density? Give reasons?
Answer:
The areas of very high density of population are West Bengal, Bihar, Uttar Prades, Kerala, etc. They are plain regions with fertile soil, whereas the area of Kerala is small compared to population
Question3. What are the areas of High population density? Give reasons?
Answer:
Areas of high population density are Tamil Nadu, Assom, etc. Agriculturally and industrially Tamil Nadu is developed and Assom is great state among northeastern states
Question 4. Give the reasons to appear normal population density In peninsular plateau?
Answer:
Peninsular plateau presents normal population density because the area is not supportive for agriculture and not too many industrial areas are there
Question 13.
It Is noted that within India certain parts like Kerala have a positive sex ratio. How can you appreciate it?
Answer:
- Kerala has a positive sex ratio while some other states are extremely biased against women
- Womens education has been a powerful force in reducing discrimination against women
- Womens literacy and schooling reduce child mortality and work against the selective neglect of the health of girls
- As Kerala worked on these front, remaining states need to follow its footsteps
Question 14.
Write some slogans about the problems of overpopulation?
Answer:
- Birth of a child is a good omen In ones life. But if the population is going on increased whether the family or the country could contain it or not that is the question. - Malini Balasingam
- Birth of every child Is an impulse of development - EctwIn Canon
- Every new childbirth on the earth creates an economic hell. - T.R. Malhos
Question 15.
Overpopulation creates many problems." Do you support this statement? Wilts in your own words?
Answer:
- The number of non-working people increases
- Per capita income decreases with increase in population
- Production has to be increased to provide facilities like houses, educational institutions, health centres, and transport. etc. to the increasing population
- There is a danger of occurrence of famine if sufficient food is not produced
Question 16.
Answer the following of questions based on the graph given below?
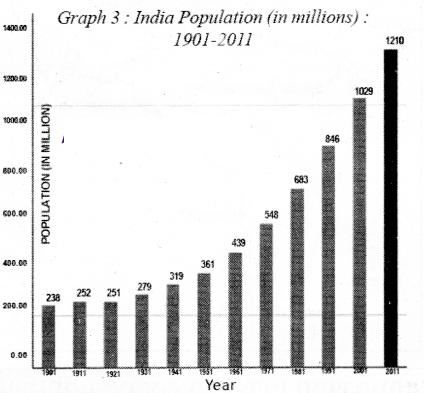
Question (A) From which year did the population Increase continuously?
Answer:
From the year 1921, the population increased continuously
Question (B) What is the present population of India?
Answer:
The present population of India is 121 crores
Question (C) In which decade Is the population growth less?
Answer:
The population growth is less in the decade 1911-21
Question (D) For how many years Is the census being taken in India?
Answer:
The census is being taken in India for ten years once
Question 17.
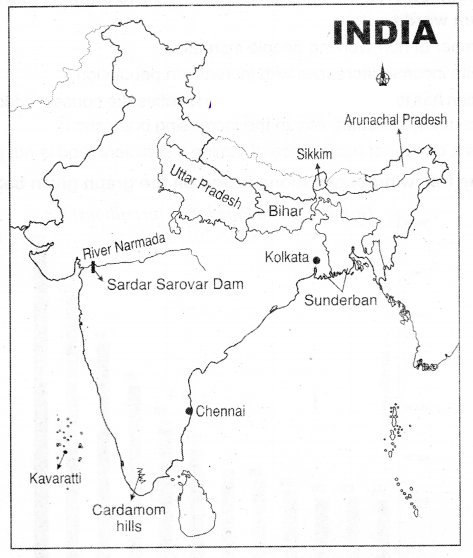
Locate the following in the given map of India?
Question 1. Alla super cyclone affected the Delta Region?
Answer:
Sunderban
Question 2. Capital of Lakshadweep Islands?
Answer:
Kavaratti
Question 3. The density of population is very high in this state?
Answer:
Bihar
Question 4. The density of population Is very low in this state?
Answer:
Arunachal Pradesh
Question 5. The highest populous state?
Answer:
Uttar Pradesh
Question 6. The lowest populous state?
Answer:
Sikkim
Question 7. Sardar Sarovar dam is constructed on?
Answer:
Narmada River
Question 8. The capital of Tamilnadu?
Answer:
Chennai
Question 9. The capital of West Bengal?
Answer:
Kolkata